
Editorials and Articles Archive
Scattergories
A thousand pictures are sometimes worth one word: "Wow."
23 April 2011
Thankfully,AI10's flirtation with modern music last week wasn't the disaster that many American Idol fans expected. Nowhere in Idolville was there a bigger sigh of relief breathed than here at WNTS Headquarters. While we are perfectly aware that a 51 average approval rating isn't exactly water-cooler material, we feared that another low-40s snoozefest would scare the producers away from contemporary music for good. (Given that they cued up Carole King Night next, we'd have to guess that the folks at 19E weren't terribly optimistic themselves.)
Of course, it surely helped that six of the seven performances this week were of first-time Idol songs, and the seventh (Dance With My Father) had only been sung once before...and not terribly well at that. That works out to an episode repeat factor of just 0.14, meaning that Wednesday's show featured some of the freshest music in the show's history. We'd say this was a welcome change of pace, inasmuch as there have been 119 non-Finale episodes from Season Three on, and just 20 had a repeat factor of 1.0 or higher. Seven of those 20 are from Season Ten. Yowch.
In other news, the media is still debating whether or not the AI voting public has a grudge against female contestants. Two weeks ago, we reported the elimination bias against the girls had risen only slightly since Season Seven, from 4.2% to 4.4%, because the guys' approval ratings have gotten considerably stronger during that interval. Correspondent Daniel asked us to re-look at this number, as his own calculations showed a more pronounced jump in what might be termed the "Guy Bonus". Whoops – our apologies, but Daniel is correct. We neglected to take the actual male/female ratios of each episode into account properly. Bottom line: The actual Guy Bonus is now 5.1%, compounded weekly.
(We should explain to our newer readers what "compounded weekly" means. Suppose there are two contestants, Gary Guy and Greta Girl, who posted identical approval ratings on Wednesday night. On Thursday, one or the other is to go home. On average, Greta will get the axe about 21 times out of 40, or 52.5% to 47.5%. Not that big of a deal, you say? Perhaps so, but consider what happens when Greta has to go up against a different guy the next week...and the following week...and the week after that.... Our back-of-the-envelope calculations show that, in a Finals group of six men and six women, all equally strong but with a weekly Guy Bonus of 5.1%, the resulting American Idol champion will be male roughly four seasons out of seven. That amounts to 14% fewer female champions over time – an unusual example of the power of compound interest.)
Contemplating all of this, we wondered: what should our topic be for this weekend's editorial? Should we do a study on song age, repeat factors, gender inequity, elimination patterns, or perhaps even approval ratings? After a brief huddle, we decided to go with...all of the above.
Simultaneously.
A 1300-Voice Chorus
Victor Frankenstein has nothing on us. If you have not yet run screaming from the room at the sight of the above monstrosity, we thank you for your fortitude. Please let us explain what it all means.
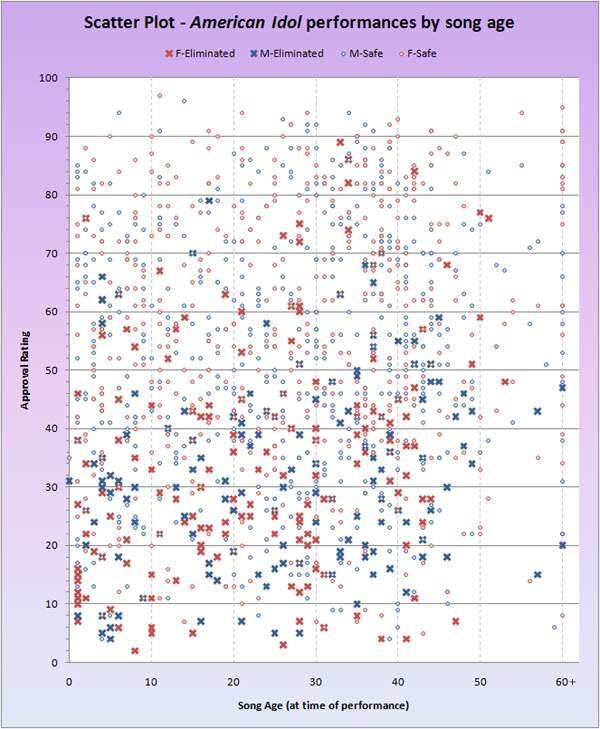
What you're seeing is a scatterplot of all American Idol performances of the past ten years. Well, almost all of them. We removed reprise performances and those from any season Finale, since there is little to be gained by studying what amounts to glorified rehearsals. That left us with 1308 'X's and 'O's in the graph – the former represent elimination performance (i.e., those in which the contestant went home or were saved the next night), the latter represent safe outcomes. Unimaginatively enough, pink is for girls and blue is for boys.
Each performance is plotted in two dimensions. The X (horizontal) axis repesents the age of the song as of the episode's air date. The Y (vertical) access is the final approval rating of the performance; higher means better-liked. Some of the markers in the graph occlude others, so if you're anal enough to count them and you arrive at fewer than 1308, we're not interested in hearing about it. Really, we're not.
Right away you can observe some interesting facts. No male contestant has ever gone home prior to the Finale on a 5-star performance. In fact, just one has exited on a rating higher than 70 – that would be Phil Stacey in AI6's double-elimination Bon Jovi Night. A whopping eleven girls, however, have shared Stacey's fate. including Pia Toscano a few weeks back.
Note too that no girl has been dismissed singing a song more than 55 years old, whereas four guys have met that fate. That feels to us more like a curiosity than an actual trend.
As you would expect, the vast majority of 'X's are in the lower half of the graph. In the very bottom left, running up and down the one-year-old column, you'll find a stack of 'X's that illustrate rather strikingly what AI voters think of contestants, particularly female ones, who sing modern songs poorly.
This leads to another eye-popping revelation. Thus far there have been 39 one-star performances of songs ten years of age or younger. Nine of the 17 guys who turned in a Contemporary Clunker, as it were, survived to sing again; that's 53%. But over in the other dressing room, just four of the 22 girls in similar straits made it through! That's only 9%, an insane 44 percentage-point difference. (Curiously, two of those four performances were by the same singer, AI4 semifinalist Janay Castine.) The take-away here is that America is vastly more forgiving of men stinking up the stage with modern material than women. We'll leave it to the Idolsphere to plumb the reasons for that.
Setting The Trend
No doubt there are more nuggets of interest to be found in Frankengraph, but we're starting to see spots in front of our eyes, so let's move on. A few weeks ago we showed, grudgingly, that older material tends to rate somewhat higher on American Idol than newer songs, all else being equal. What does our scatterplot tell us about the strength of this correlation? More importantly perhaps, what if anything does it tell us about the relationship between song age and voting safety?
The best way to visualize this is to add trend lines to our graph. We can do this painstaking task the way we learned it in college, using linear algebra and least-squares regression analysis. Or, we can just let Microsoft Excel plot the lines for us at the click of a mouse. Guess which way we chose?
Here is Son Of Frankengraph:
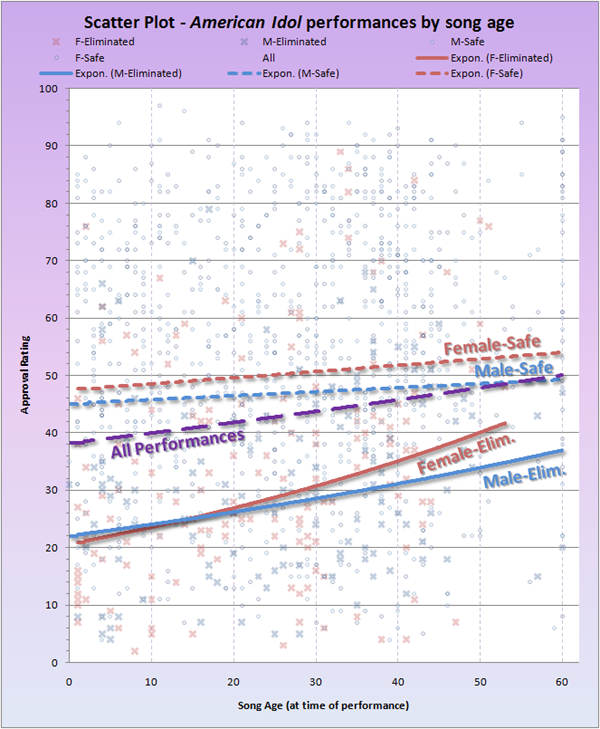
The solid lines represent elimination performances, short dashed lines are safe performances, and once again we're going with the whole trite pink/blue stuff. We also added a purple line that represents the union of all performances. We already knew that older songs tended to make for better-liked offerings, but for the first time we can actually quantify the degree.
To begin, note that all five lines have positive slopes – the older the song, the higher the expected approval rating. This is true whether you're male or female, and whether you're about to be sent to the couch or the airport. The slope of the purple line is almost exactly 0.20 rating points/year. In a nutshell, that means for every 10 additional years of song age you choose, you can expect 2 added points in your approval rating, a not-insignificant figure. (We pause briefly here to curse under our breath. There.)
But hold the phone a minute. Note that both elimination trend lines have a markedly greater slope than their respective "safe" lines. Be still our beating hearts...can this mean...?? Why, yes, it sure does:
The ratings gap between safe performances and fatal ones narrows greatly as the songs get older. Near as we can tell, the pink trend lines will intersect somewhere around 75 years/58 rating, at which point a girl gains no safety benefit for having sung a golden oldie well. The male lines will take a little longer to meet, but that doesn't mean you have to sing Amazing Grace before they do: it looks like about 100 years/55 rating.
So, while America tends to appreciate performances of older songs to newer ones, you had better sing the lights out if you choose the former route, because the voters aren't as accommodating. Contestants do not have to sing newer songs nearly as well in order to advance. That was an unexpected finding, but we hope it's one that will nudge future Idols, when faced with what seems to be a toss-up between a more contemporary song and an older one, to risk recency.
Incidentally, if you are still skeptical that there is a Guy Bonus on American Idol, we hope the "safe" trend lines on the second scatterplot put the issue to rest. Historically, the average girl has to sing 3 to 4 rating points better than the average guy in order to advance.
Next Sunday, we'll redo this "scatter"-brained exercise with song repeat factors. See you then.
- The WNTS.com Team
