
Editorials and Articles Archive
Go South, Young Man!
How the South is getting its revenge on the North through American Idol
31 January 2009
Welcome back to our third installment on Idolmetrics, the scientific study of success and survival on American Idol. Over the past two weeks, we looked at the historical impact that a contestant's sex and age have had on their expected survival rate (hint: the former matters, the latter doesn't.) This time around, we're going to cover a less touchy topic: geography. All else being equal, when the voters contemplate which contestant to send home, does it make a difference where that home happens to be?
So once again, let's trot out Ryan Seacrest to host the latest episode of Smile & Wave Night. This time, he's got lots of company: a whopping 52 anonymous contestants, representing each U.S. state plus the District of Columbia and Puerto Rico. We've sent all of them out on national TV in skimpy swimsuits and sashes, just like in the Miss America pageant – this, after all, is American Idol, where public abject humiliation of our employees is part of the job description. The next night, assuming the stage doesn't collapse from the sheer weight of the bodies, which of these fine folks are more likely to get the boot?
...From California, To The New York Island...
Before we reveal the not-terribly-surprising answer, let's take a quick look at how the various state delegations have fared on AI thus far, relative to one another. It's actually been a quite contentious, hard-fought, internicine battle. Think of it like the musical 1776, except with worse singers.
| State | Contes. | Apps. |
|---|---|---|
| 1. California | 31 | 97 |
| 2. New York | 17 | 48 |
| 3. Georgia | 16 | 62 |
| 4. Texas | 14 | 67 |
| 5. Florida | 13 | 69 |
| 6t Illinois | 9 | 27 |
| 6t Tennessee | 9 | 48 |
| 8t New Jersey | 8 | 19 |
| 8t North Carolina | 8 | 59 |
| 10. Indiana | 6 | 12 |
First of all, 20 of our 52 contingents haven't officially taken the stage yet! That's right: the 194 semifinalists of the first seven seasons have been drawn from just 32 states. California, naturally leads the way at 31 Idols, with New York, Georgia, Texas, and Florida a fair ways behind. Five states have produced a single contestant apiece, with Wisconsin and Arkansas having the shortest shelf life: both of their representatives went one-and-done (Tiara Purifoy and Patrick Hall, respectively.) Despite the old entertainment industry maxim, nobody has ever been sent back to Kansas...mainly because no Idol has ever hailed from the Sunflower State. To our Jayhawk friends, along with the millions of good folks in Alaska, Delaware, Iowa, Kentucky, Maine, Minnesota, Mississippi, Montana, North Dakota, Nebraska, New Hampshire, New Mexico, Puerto Rico, Rhode Island, South Dakota, Vermont, Washington DC, West Virginia, and Wyoming, we can only offer you two words of sage advice: sing better.
| State | Rating | Elim. Rate |
|---|---|---|
| 1. Maryland (1) | 77.7 | 14.3 % |
| 2. Alabama (3) | 67.7 | 2.5 % |
| 3. Tennessee (9) | 66.3 | 18.8 % |
| 4. Missouri (4) | 60.0 | 16.0 % |
| 5. Arizona (5) | 58.0 | 12.5 % |
| 6. North Carolina (8) | 55.9 | 11.9 % |
| 7. Oklahoma (3) | 55.6 | 11.8 % |
| 8. Michigan (2) | 52.0 | 9.1 % |
| 9. Florida (13) | 51.4 | 18.8 % |
| 10. Virginia (4) | 51.0 | 14.3 % |
Sherman, set the Wayback Machine to the summer of 2002. The very first contestant to take the Idol stage was the pride of Takoma Park, MD: Tamyra Gray. She belted And I Am Telling You I'm Not Going to a near-showstopping 88 rating, and since then, Maryland has never looked back. For every minute of AI's existence, the land of crabcakes has led the list of average approval rating by state. Of course, that's largely due to the fact that Maryland has not had a contestant since Gray, so her 77.7 rating has remained unsullied. In fact, just ten states (as shown in the accompanying Top 10 table) are above average through the first seven seasons, making American Idol something of an anti-Lake Wobegon.
Though Alabama has produced only a trio of Idols thus far, they've done their fair state proud. All three – Ruben Studdard, Bo Bice, and Taylor Hicks – have made it all the way to the Finale, giving Alabama a lead in average elimination rate (an astounding 2.5%) that might require a couple of Bobby Bennetts to relinquish. Michigan isn't too far behind at 9.1%, thanks to their having produced a pair of fourth-place finishers, Josh Gracin and LaKisha Jones.
| State | Rating | Elim. Rate |
|---|---|---|
| 1. Indiana (6) | 30.1 | 50.0 % |
| 2t Nevada (3) | 31.9 | 33.3 % |
| 2t Ohio (5) | 31.9 | 27.8 % |
| 4. Colorado (3) | 33.0 | 27.3 % |
| 5. Idaho (1) | 33.3 | 14.3 % |
| 6. Oregon (2) | 35.2 | 20.0 % |
| 7. Hawaii (4) | 36.5 | 22.2 % |
| 8. Connecticut (1) | 38.7 | 25.0 % |
| 9. New York (17) | 38.8 | 33.3 % |
| 10. New Jersey (8) | 39.4 | 42.1 % |
At the other end of the scale, Indiana might lead the country in producing outstanding sports movies (we mildly prefer Breaking Away to Hoosiers, if it matters), but when it comes to the Idol stage, the Hoosier State has left a lot to be desired. Its six contestants thus far have sung to a rather dismal 30.1 average rating and a 50% elimination rate. Not until Season Seven's Luke Menard and Amanda Overmyer had an Indianan so much as survived to a second round.
To be fair, the WhatNotToSing.com staff's home state of New Jersey hasn't exactly lit the stage on fire either. Just one of our eight representatives has reached the finals, Anwar Robinson, making our 42.1% elimination rate the fifth-worst. But (cough-cough), we might point out that none of the eight hailed from South Jersey, which salves our egos just a little.
Of course, we don't have nearly enough datapoints for each state to draw anything resembling a meaningful conclusion. Time for a little bit of aggregation....
It's A Town Full Of Losers, And I'm Pullin' Out Of Here To Win
We've divided our 52 "states" into four geographical regions: Northeast, South, Midwest, and West. The boundary lines we drew are not an exact science: e.g., where would you assign Oklahoma, to the South or the Midwest? (We chose the latter.) But, we didn't do anything nutty like put Vermont in the West, and our arrangement left us with four roughly equal-sized groups to work with. Equal size, however, doesn't mean equal representation:
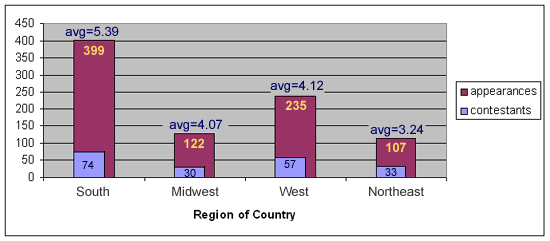
As our first chart shows, two regions have dominated the Idol race thus far. The South has produced 74 contestants (and four winners), who have collectively made 399 appearances on the show. (Our weekly friendly reminder: an appearance corresponds to an episode rather than a performance.) The West is a distant second at 57 and 235, but they're still miles ahead of the shivering denizens of the Northeast and Midwest. Those two regions have combined for just 63 contestants and 229 appearances. Fun Fact Of The Day: the Northeast, home of roughly one-third of the United States population, has produced just nine of 82 finalists thus far!
Dixieland maintains its enormous lead when we look at staying power. On average, a Southern Idol makes almost 5.4 appearances, the highest of any demographic group we've considered so far. Thanks largely to champions Carrie Underwood and David Cook, the Midwest has nearly closed the gap on the West for second place, 4.12 to 4.07. Our homies from the Northeast still bring up the rear.
But once again, before we conclude that the voters only have eyes for Southern belles and Confederate rebels, we need to take performance quality into account. It may just be that Dixie's divas have simply sung better. This brings us to our next chart:
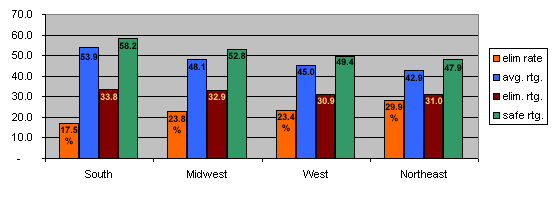
The blue bars, which represent overall approval rating, are the key. The South has indeed risen again; its contestants have sung to nearly a 54 average. The Midwest is in second with a fairly substantial 3-point ratings lead over the West. We won't discuss the Northeast, except to grumpily point out that, almost surely, our contestants can beat up your contestants.
Note yet again that the orange bars, which represent the elimination rate, tend to get longer as the blue bars get shorter. No matter what any other source tells you, nothing matters as much as singing quality.
Okay, the hard numbers on how geography may or may not affect the survival rate. As usual, we'll measure this as the difference between the actual elimination rate of the contestants and the expected historical rate based on their approval ratings. We'll present in tabular form using the West region as a baseline, because their elimination rate is almost exactly what raw probability would predict:
| Region | Expected | Actual | Delta |
|---|---|---|---|
| South | +4.46 % | +5.86 % | +1.40 % |
| Midwest | +1.41 % | -0.37 % | - 1.78 % |
| West | 0 | 0 | 0 |
| Northeast | -1.11 % | -6.50% | -5.39 % |
Looking at the rightmost column, the South seems to have a 1.4% advantage – that is, their contestants are about 1.4% more likely to advance to the next round than what their (excellent) approval ratings would predict. This is within the margin of error for our experiment so we can't draw a firm conclusion, but it still makes the South the one and only region that advances more often than probability would predict. Conversely, Midwestern contestants seem to have a 1.8% disadvantage, again within our margin of error but high enough to be more likely a trend than a mirage.
But the Northeast is a different matter. True, those "Rust Belt" singers have, by and large, not sung all that well, but America has still sent them home at a 5.4% greater clip than one would expect. This value is well outside our margin of error. Thus, if you're from this part of the country and your dream is to become the next American Idol, we advise you to move to Alabama and learn how to drawl.
Life In A Northern Town
We can't offer any scientific evidence as to why the Geography Gap exists, but that's okay – idle speculation and wild guesses are more fun anyway. As a bonus, we'll even throw out two guesses.
- Could regional stereotypes be partly in play? Take a look at the nine finalists thus far from New England and the Middle Atlantic states: Christina Christian, Tamyra Gray, Justin Guarini, Julia DeMato, John Stevens, Anwar Robinson, Constantine Maroulis, Anthony Federov, and Kevin Covais. Quite a few of that lot brought outsized, love-them-or-hate-them personalities to the table. We wonder if that effect is magnified if it comes complete with a New York or Boston accent.
- Perhaps this is a stereotype too, but our parochial impression is that other areas of the country enjoy a much stronger sense of regional identity. True, a Georgia Bulldogs fan and a Florida Gators fan do not necessarily mix well, but at the end of the day they both probably self-identify as Southerners. The Northeast (and perhaps the West as well) is nothing like that; we self-identify in much smaller tribes based around our major cities. Truth is, Bostonians and New Yorkers and Philadelphians pretty much hate each other (in a friendly way...sometimes), and this may result in a lack of voting cohesiveness.
At any rate, with 26 folks from the New York auditions advancing to Hollywood, perhaps this will be the year that the long-overdue Northeast finally gets an American Idol champ of our very own. That's how we'll be rooting, anyway. You got a problem wit' dat?
- The WNTS.com Team
