
Editorials and Articles Archive
Black and White and Flat All Over
How race and ethnicity affect the voting outcomes on American Idol
7 February 2009
"There is a yellow one/That won't accept the black one/That won't accept the red one/That won't accept the white one...." The lyrics of that 1968 Sly & The Family Stone classic seem a little dated here in the multicultural 2000's, in more ways than one. One might expect that this is particularly true for American Idol, an institution that has proven beyond a shadow of a doubt that delusional overestimation of one's talents is a trait that cuts across all genealogical lines. But does that extend to the show's loyal viewers too? If we studied the voting patterns from the past seven seasons, would we find that America is as color blind as they are tone deaf?
You know what this means, of course. It's time for another episode of Smile & Wave Night, the hypothetical exercise at the heart of our season-long series on Idolmetrics. Previously we covered the effects of sex, age, and home region. Tonight we bring you 12 anonymous contestants of different races, creeds, colors, and nationalities – an off-tune rainbow of diversity, in other words. Except that tomorrow night, when the voting results are announced, our little group will get a little less diverse because someone is going to be sent home. Based on the patterns of the first seven years, who do you suppose it will be?
Who Are You? Who, Who...?
This was by far the most complicated of our Idolmetrics studies. That's not because of the sensitivity of the subject (we'll get to that later), but because of the difficulty in nailing down objective datapoints.
It's easy enough to look up a contestant's age and hometown on the Web, and we're pretty confident we can guess their sex ten times out of ten (though there've been a few who've given us pause.) However, race and ethnicity are tricky. The understandable lack of readily-accessible demographic information, plus the exploding number of mixed-race Americans, plus the fact that a Hispanic may be of any race, plus a dozen other minor factors thrown in, gave us the sort of migraine headache that we usually reserve for Hollywood Group Night.
The only good way to determine a person's heritage is to ask them directly, an option we unfortunately didn't have. Thus, we had to resort to public bios, promotional websites, Facebook and MySpace profiles, and whatever other sources we could dig up. Bravely, we soldiered on. We were careful not to jump to conclusions rashly; for example, we didn't automatically classify every Spanish-surnamed contestant as Hispanic until we had some evidence that they were truly of Latino descent.
| Group | Contes. |
|---|---|
| White | 99 |
| Black | 61 |
| Hispanic | 16 |
| Pacific Islander | 7 |
| Asian | 2 |
| Other | 2 |
| Mixed Race | 7 |
Throughout this exercise, our guiding rule was, in a nutshell, "do the right thing," whatever that meant in context. For example, Jordin Sparks is half black and half white, but in interviews she refers to herself as African-American. Good enough for us. David Archuleta, on the other hand, has a Honduran-American mother but a father of European descent. Some web sources say he's Hispanic, others say white, and quite a few assert that he's partly Filipino, too. Oy. Right or wrong, we classified him as being of mixed race (yes, we know, that term applies to everybody, but work with us here.)
Ultimately, most of our worries were for naught. We didn't have nearly enough datapoints to draw separate conclusions on Asian, Pacific Islander, Hispanic, Native American, Middle Eastern, or mixed race contestants (see nearby table.) So, we aggregated them into one catchall group called Mixed/Other, to go alongside Black and White. A bit culturally insensitive of us perhaps, but it was the best we could do.
...It Turns By Day, And Then By Night...
The most striking thing you'll find in the chart of raw demographics is the number of black contestants thus far. African-Americans make up about 13% of the U.S. population, but they've comprised over 30% of American Idol semifinalists. Whites and non-whites have enjoyed roughly equal representation, but keep in mind that we chose, for statistical and simplicity reasons, to put white Hispanic contestants like David Hernandez in the Mixed/Other category. The full breakdown:
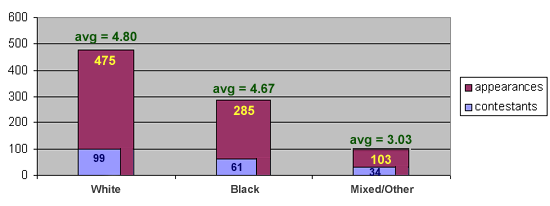
When it comes to staying power, another surprising fact emerges. Black and white contestants on average make roughly the same number of appearances, but that number plummets for our Mixed/Other group. Drilling down into the data, our crack Math Dept. found that Asians/Pacific Islanders (4.33) have stuck around for close to the same number of episodes as blacks and whites, but Hispanics (2.29) and mixed-race (3.13) contestants have had a much shorter shelf life. Depending on how one counts, there've only been between three and five Hispanic finalists out of the first 84: Vanessa Olivarez, David Hernandez, and Jason Castro for certain; David Archuleta probably; plus the curious case of Mario Vasquez. Note that three of those five hailed from Season Seven.
As always though, the opera's not over until the fat lady sings and we calculate her approval rating. It may be that any discrepencies in elimination rate can be explained by variances in performance quality. Our second chart shows that there has indeed been an approval ratings gap of note...except it's not exactly where you'd expect to find it.
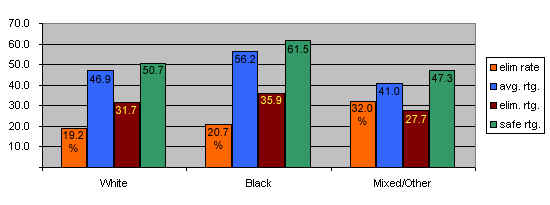
We had an inkling when we began this exercise that we'd find that African-American contestants had outsung all others. But, a 9-point gap over Euro-Americans, and a 15-pointer over the rest, is astounding. Note that for the first time since we started our journey on the Idolmetrics Highway that the strong correlation between approval ratings (blue) and elimination rate (orange) has been broken. White contestants have a slight edge in the latter despite the substantial deficit in the former.
So once more, let's do the math. The historical gap in elimination rate between a 56.2 rating and a 46.9 is about 4.9%. All else being equal, we'd expect that black contestants would advance over white ones by approxmiately that percentage. Instead, white contestants have a 0.9% edge. Meanwhile, the E.R. gap between a 56.2 and a 41.0 is 7.9%, but the Mixed/Other group actually goes home 11.3% more often than blacks. Both deltas are outside the margin of error for the experiment, indicating that something other than normal randomness is at work.
Thus our conclusion, which may or may not make some readers uncomfortable, is as follows:
Through the first seven seasons, a white contestant on American Idol is about 5.8% more likely to advance safely to the next round than a black contestant, given comparable performances. Similarly, a contestant from one of our smaller demographic groups, or of mixed race, is about 3.4% less likely to advance than a comparable black contestant.
The Rainbow Connection
So what to make of these results? For many readers, we suspect they'll view them through the prism of their political beliefs, whatever they happen to be. If you're one of these folks, hey, knock yourself out. But please bear in mind that we're a research and analysis site, not an advocacy site, and we have no agenda. We just publish facts as we find them lying around. For all you know, our next 12 analyses might result in our karma running over your dogma.
That said, the results of this study aren't all that surprising to us. American Idol voters tend to fall into one of two categories. What we term idealists cast their ballots, more or less, based on whom they believe sang the best each week. Conversely, the romantics (aka the "fanbases") fall in love with a contestant early on and vote for them through thick and thin.
It seems logical to assume that the latter group skews heavily towards Idols whom the voter closely identifies with, either vicariously or as a potential friend or relative or soulmate. Thus, we speculate (but of course cannot prove) that white romantics vote disproportionately for white contestants, black romantics for black contestants, and Hispanics and Asian-Americans and so on and so forth. If that's true, then consider the fact that about 70% of America is white, while only 50% of the contestants are so. Discuss.
Could bald racism also be a factor here? No doubt. We think it would be rather naive to believe otherwise. Still, we'd love to see the results of a study that breaks down each contestant's votes (in particular, their weekly recurring "fanbase" votes) by various demographics. Presumably the producers have focus group studies and other data that would serve this purpose, but we're not holding our breath that they'll release it any time soon.
So in the end, we know the what but can only guess at the why. Perhaps that's just as well. To borrow the words of the Rev. Dr. Martin Luther King, Jr., we dream of a day in which an American Idol contestant is judged not on the color of their skin, but on whether or not they can sing a simple little 90-second song snippet in tune without forgetting the words, tripping over a camera cable, or otherwise turning it into a nationally televised trainwreck. You may say that we're dreamers....
- The WNTS.com Team
